Rawnalyze
Connecting Exposure, ISO and Noise
Abstract
Introduction
Questions, claims expressed in discussions, forums, writings often reveal the lack of understanding of the connection between exposure, ISO setting and noise. Complaints like "the red channel is noisy" or "it is noisy even with ISO 100", or the opposite, boosting with "look how little the noise of this camera is with ISO 1600" are abundant.The following is an attempt to explain the connection between exposure, ISO setting and noise, based on noise measurements in non-demosaiced raw images. The sample images have been created with a Canon 5DMkII camera (by courtesy of Marc McCalmont), but the findings are independent of the camera make or model, except for the degree of noise and the maximum useful ISO. These images have been underexposed by 3-4 EV in order to create deep, noisy shadows; therefor the shot noise (photon noise) plays no significant role.
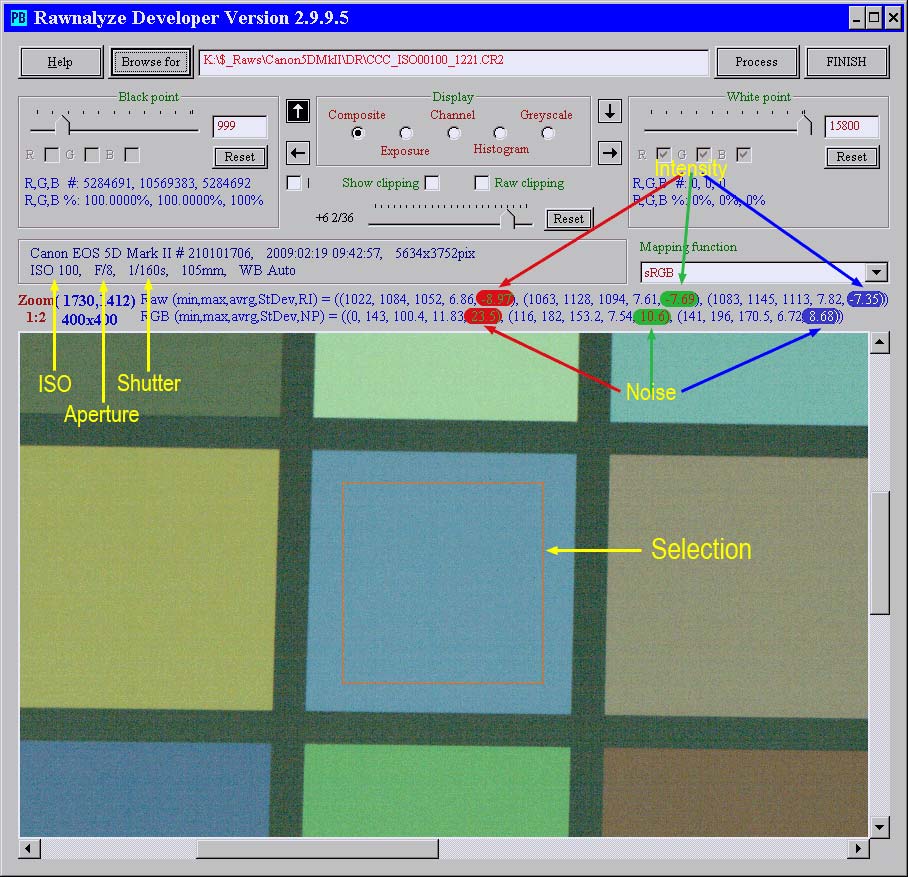
The demonstration uses uniform, evenly illuminated patches of a color checker card; the different pixel intensities (brightnesses) of the patches correspond to different exposures. The statistics explained below relate to the current selection, which is marked by an orangy rectangle. The intensity is measured in EV on the dynamic range scale from the greatest pixel value level downwards, shown by the highlighted number in the top row above the image. For example RI=−5.39 means, that the average intensity is 5.39 EV lower than the greatest pixel value possible in that situation. The lower the average pixel value in the patch, the higher this number. The patches are shown with a fixed intensity: the reds and greens with 100, the blues with 150, for better visualization. However, the intensity of any pixel or group of pixels (patches) is given in the image, it does not depend on how dark or bright they are shown in the capture.
The highlighted number in the second row shows the noise on the selected patch, measured as the standard deviation. In the example below 23.5 means that the noise level is 23.5% of the average pixel intensity on the selected area. The noise is measured as the standard deviation in percentage of the average effective pixel value in the selected patch. Another accepted unit of measurement, the signal to noise ratio (SNR or S/N) is 100 divided by this percentage. For example 25% noise corresponds to SNR=4.
Note, that the highest pixel value (called saturation level, clipping point) depends on the camera model, ISO setting, bit depth (if that is
selectable) and often on the raw channel.
In order to achieve reliable results, the noise must be measured on uniform, untextured, evenly illuminated areas; a printed color checker sheet has been used in the following samples.
Legend
The measurements are done by Rawnalyze.
A rectangular patch is selected on a clean, uniform, evenly illuminated area; the average pixel values (intensites) per raw channel and the noise are displayed
The measurement is taken from one of the raw channels, which are represented by red, green or blue color and often called the "red channel", "green channel" and "blue channel". In the following samples only the respective color is displayed with a fix intensity in order to visualize the noise in the selected patch, but this does not affect the measurement.
The noise of one raw channel is not the same as the noise of that area after raw conversion. However, the noise measured this way is easily comparable between ISO settings and exposures of the same or other cameras, because this is independent of the scenery and of the source of illumination (color temperature).
Noise and raw channels
The noise does not depend on the raw channel, only on the exposure and ISO setting. The following examples show, that the noise with close to identical pixel intensities is the same in all three raw channels, if the ISO setting is the same.
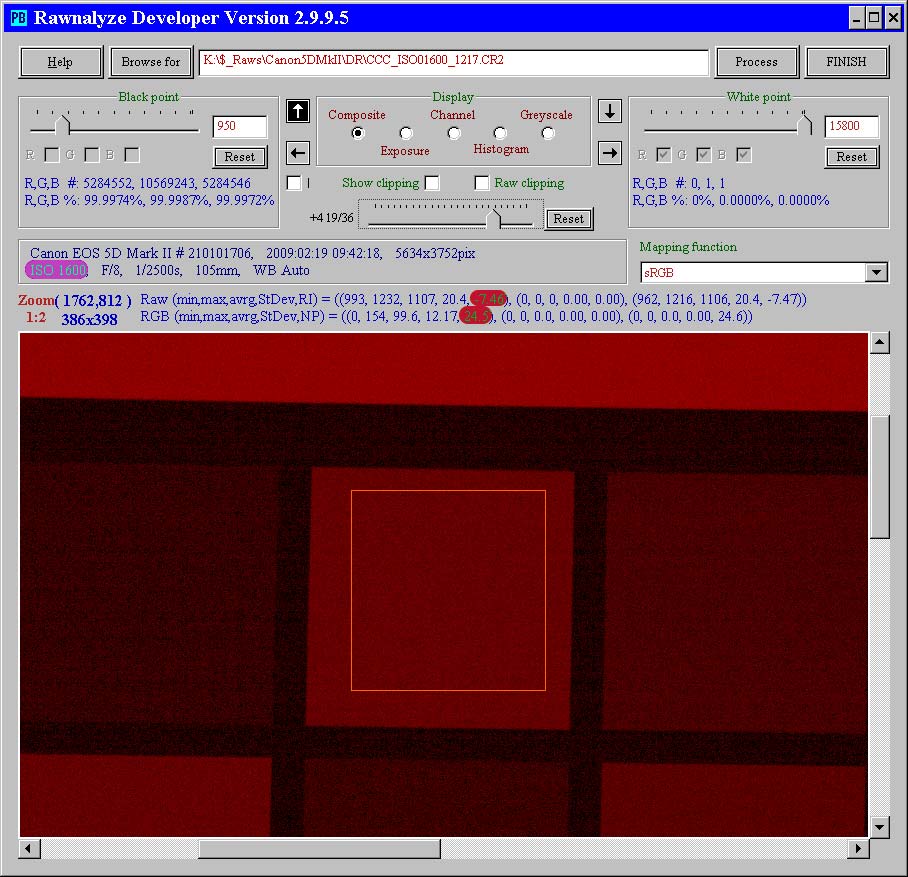
This image was created with ISO 1600. The pixel intensity is −7.46 EV, the noise is 24.5%.
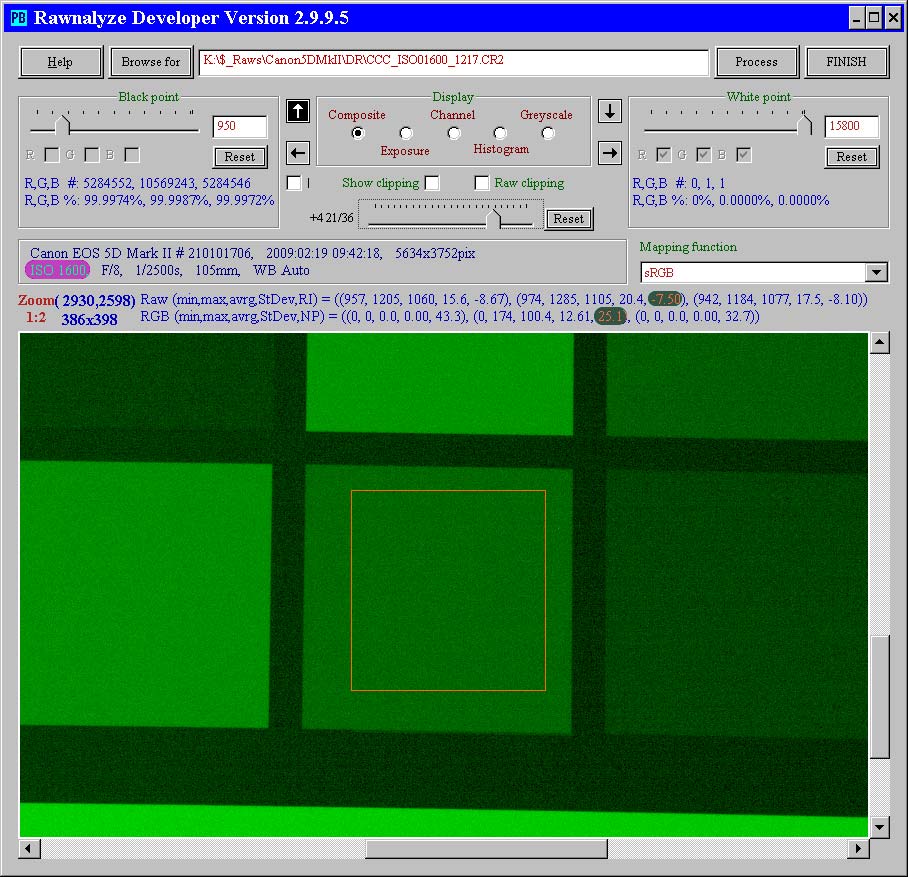
The intensity −7.50 EV in the green channel was found on another patch in the same image; the noise is 25.1%, for practical purposes the same as in the red channel.
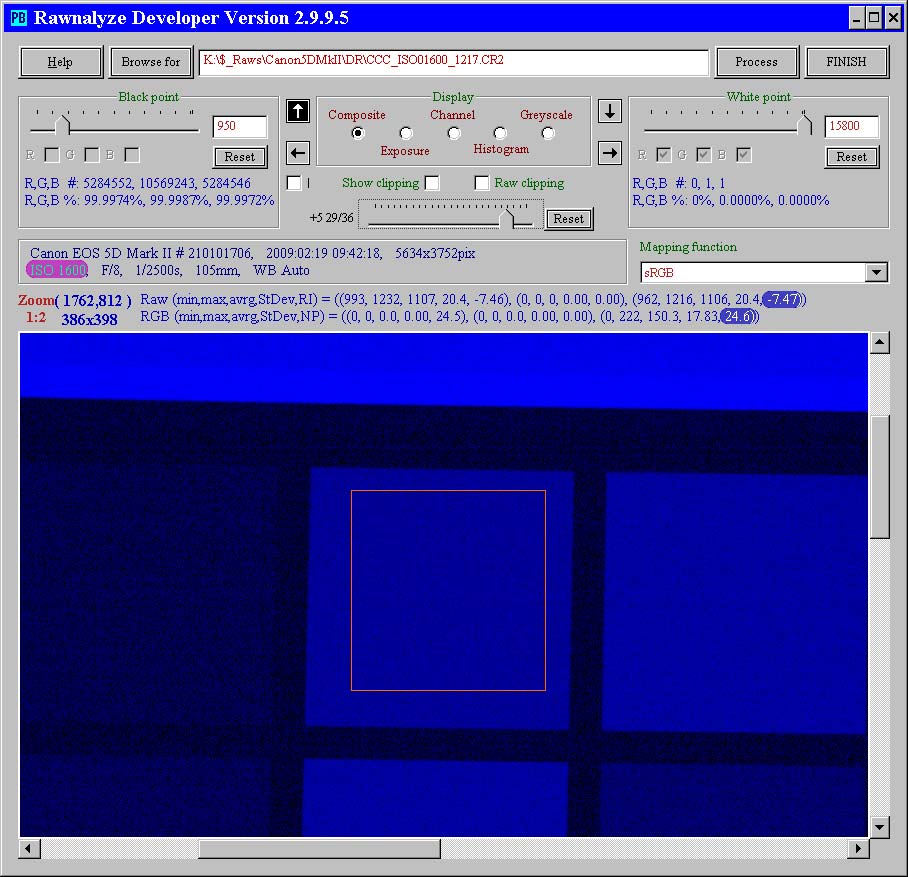
The intensity −7.47 EV in the blue channel was found on a third patch in the same image; the noise is 24.6%, the same as in the red channel.
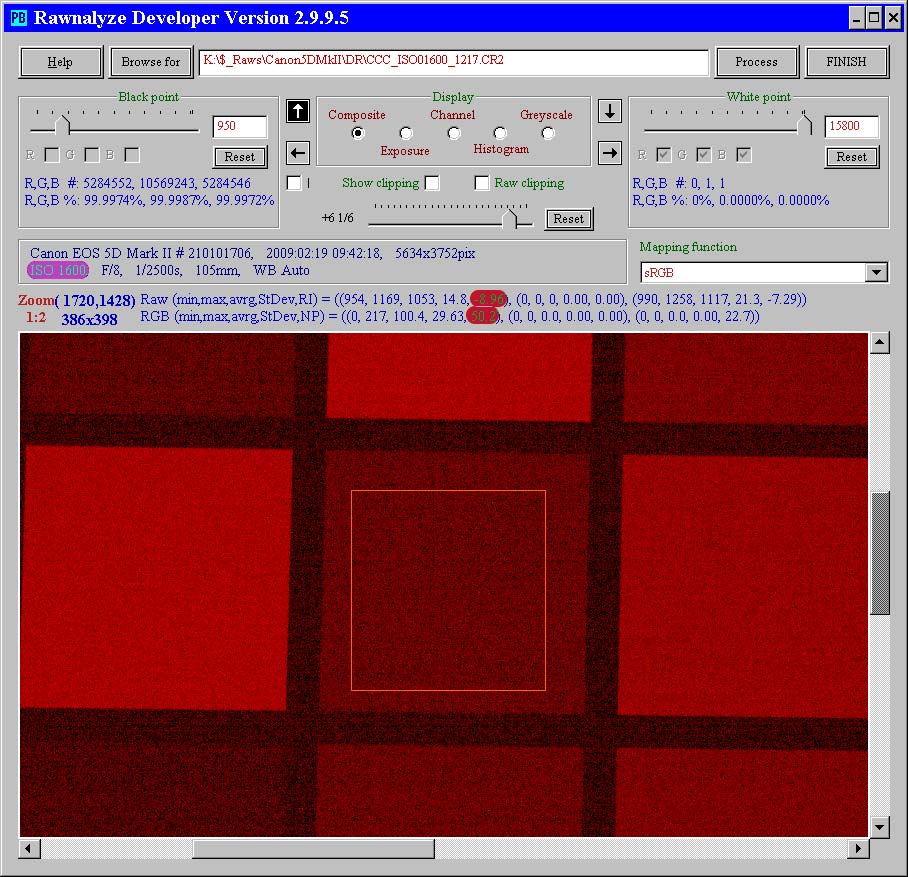
Now a noisier patch is selected from the same image. The pixel intensity is −8.96 EV, the noise is 50.2%.
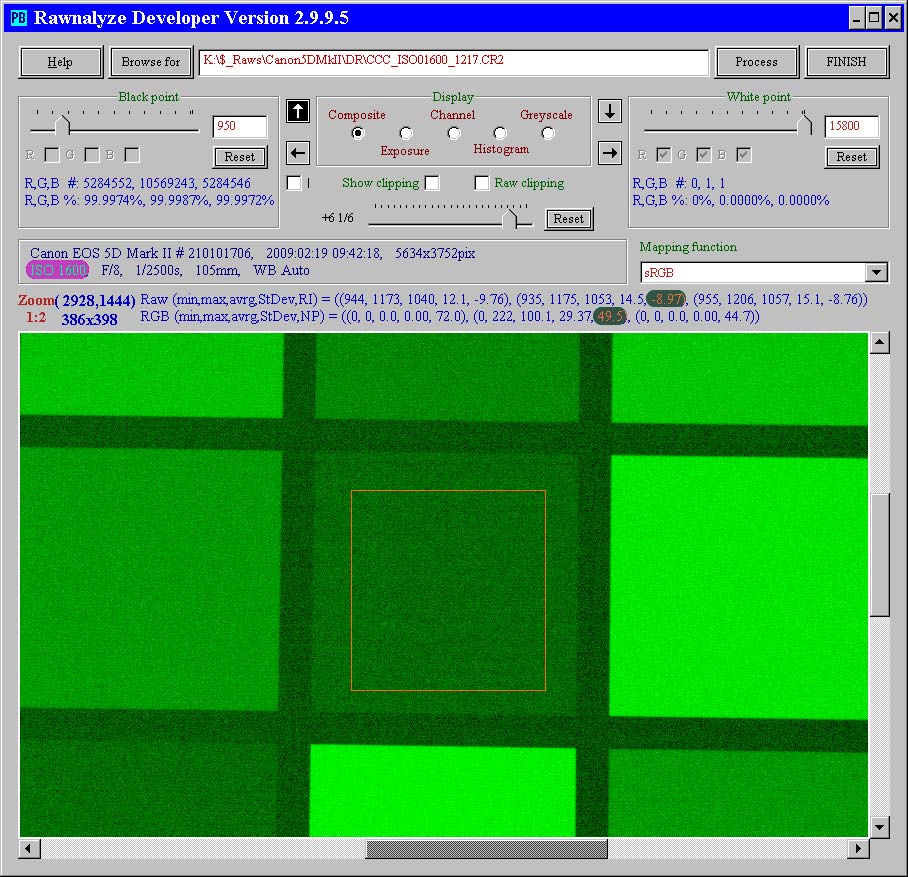
Almost the same intensity, −8.97 EV occurs in the green channel in another patch; the noise is 49.5%, practically the same as in the red channel.
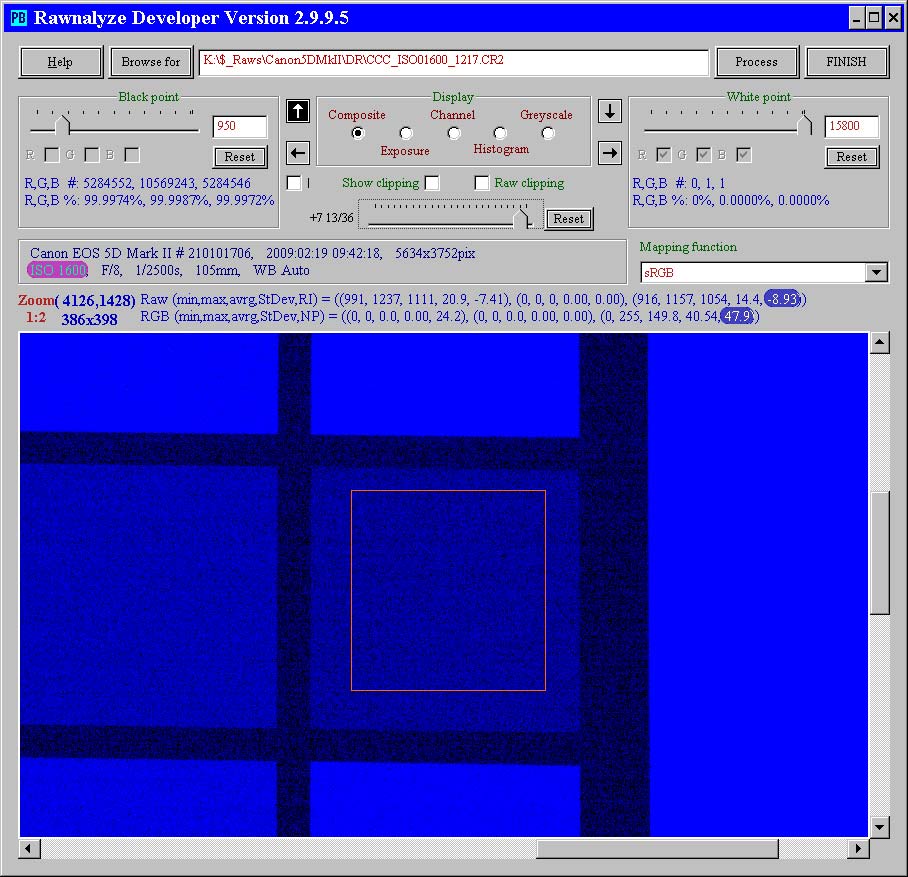
The closest intensity to −8.96 EV in the blue channel of the same image is −8.93 EV; the noise is 47.9%, close enough.
The appearance of the noise of a certain level
The following small samples demonstrate, how "much" a certain noise level is. Note, that the appearance of the noise does not depend
on the ISO, nor on the raw channel, only on the degree of noisiness.
Samples of different noise levels
Notes:
The connection between exposure, ISO and noise
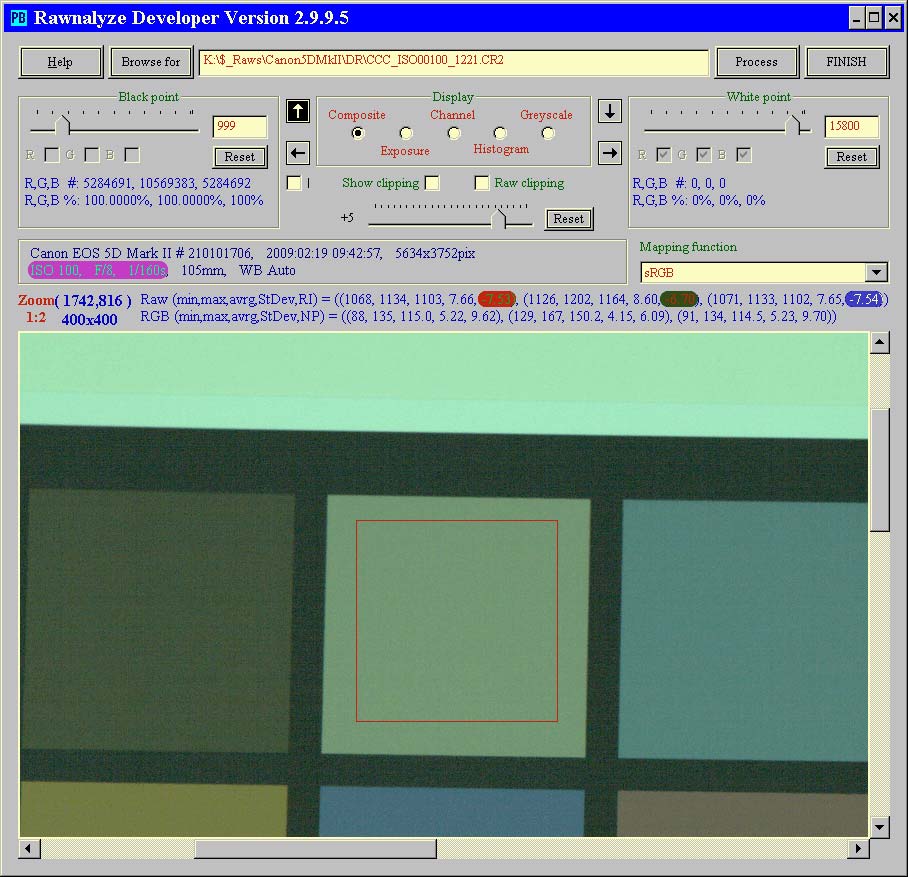
This image was created with ISO 100, f/8, 1/160sec. The intensity of the red pixels on the selected area is −7.53 EV,
the green is −6.70 EV and the blue is −7.54 EV.
(Let's not deal with the noise yet.)
This is the histogram of the raw channels.
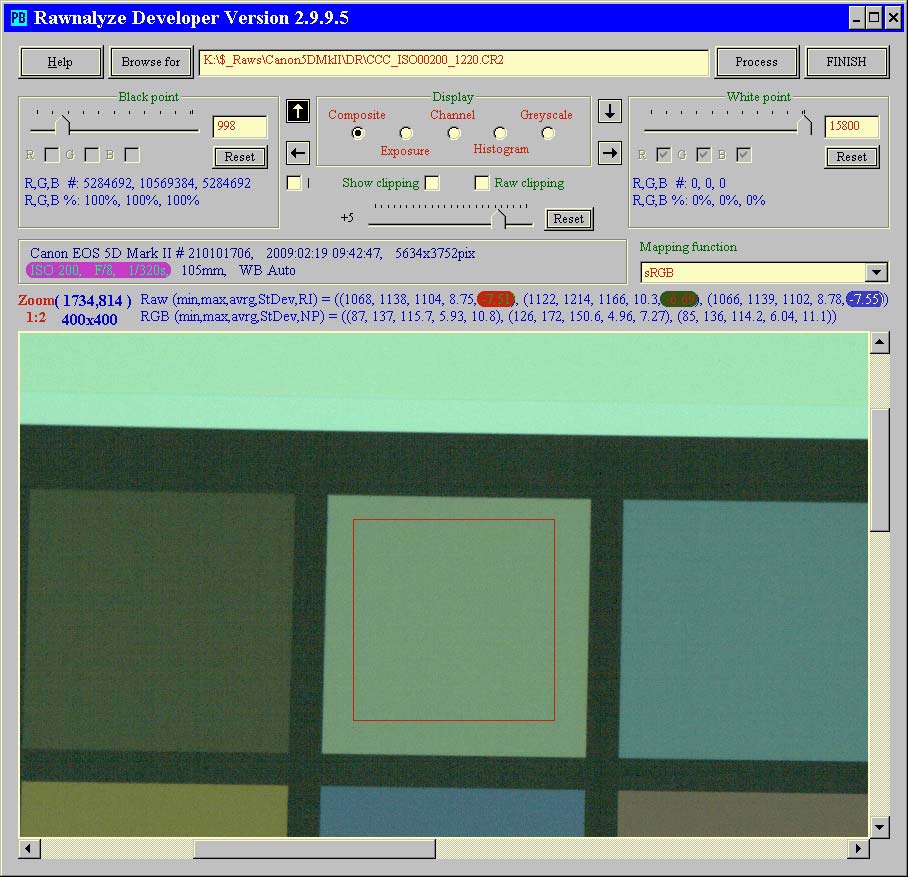
This image was created with ISO 200, f/8, 1/320sec, i.e. with half of the exposure of the first one. However, doubling the ISO setting makes up for the lower exposure, at least regarding the intensity: the red, green and blue intensities are now: −7.51 EV, −6.69 EV and −7.55 EV, respectively.
The raw channel histogram too confirms, that the higher ISO setting made up for the lower exposure.
As the above demonstration shows, the higher ISO selection is a substitute for exposure regarding the pixel intensity, but what about the noise?
The following captures shows how the noise becomes higher at increasing ISO setting. A patch with very close to −9 EV intensity is selected in each image.
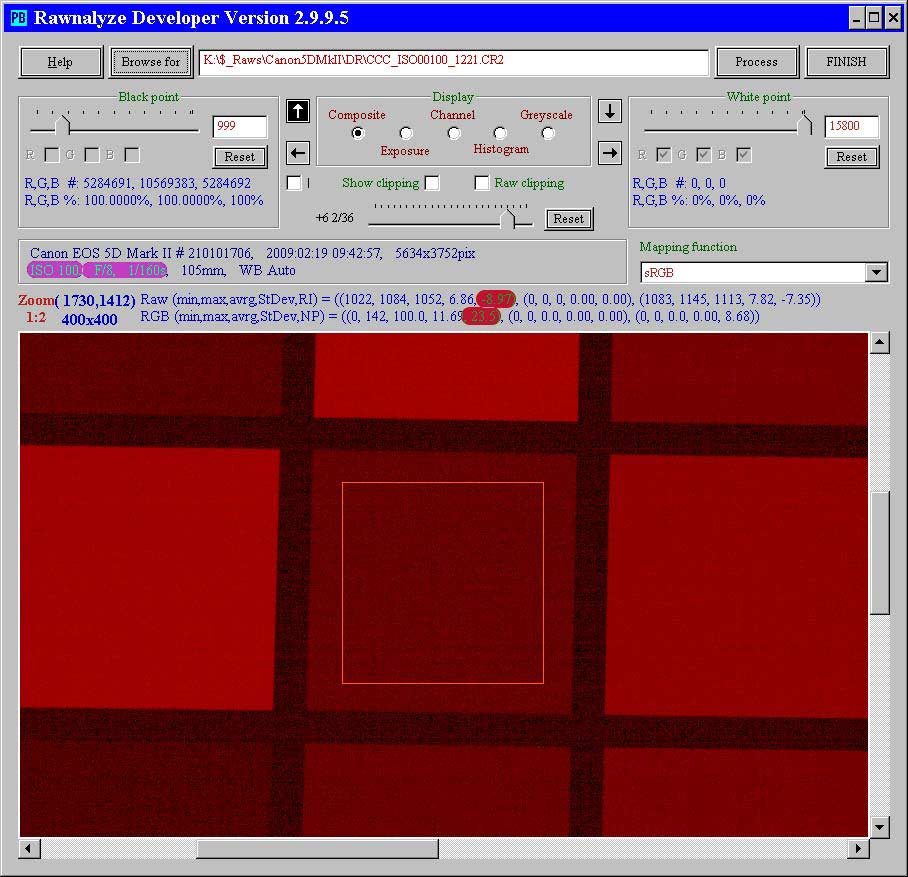
the noise is 23.5% with ISO 100, f/8, 1/160sec
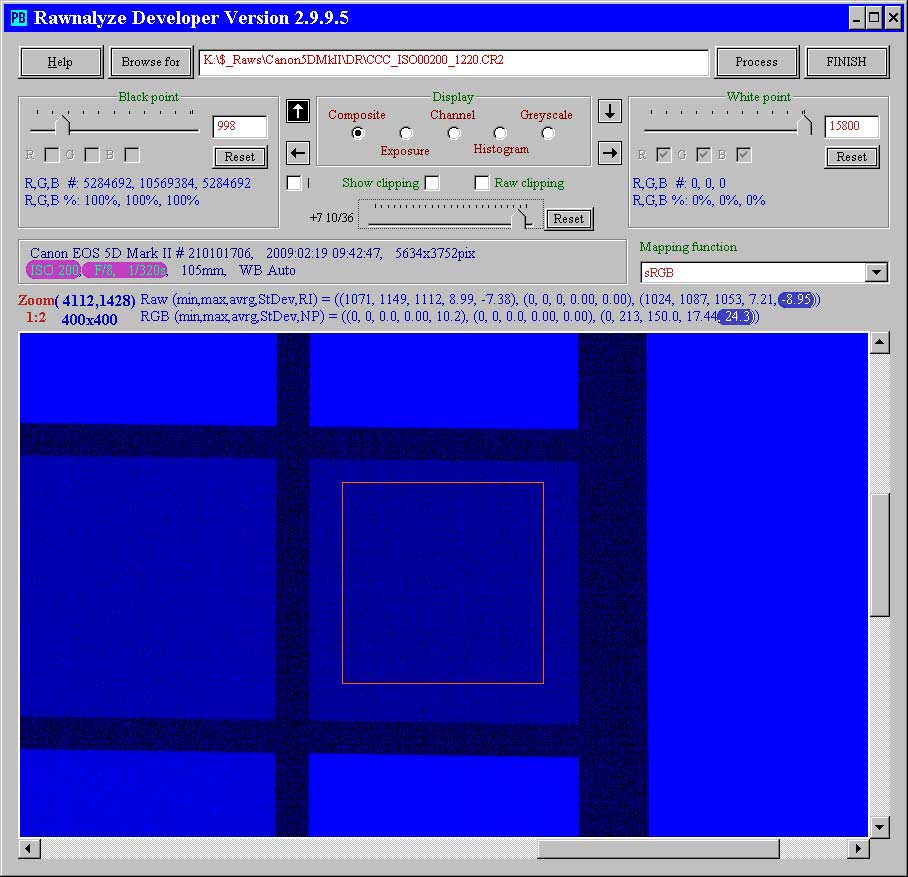
the noise is 24.3% with ISO 200, f/8, 1/320sec
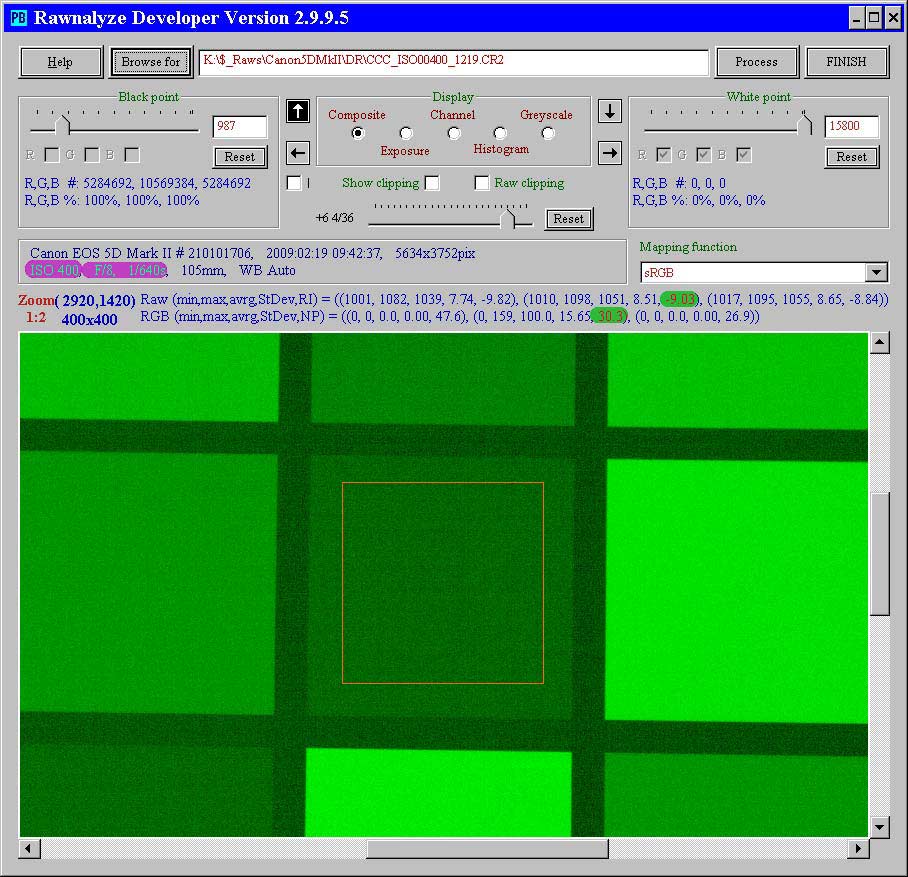
the noise is 30.3% with ISO 400, f/8, 1/640sec
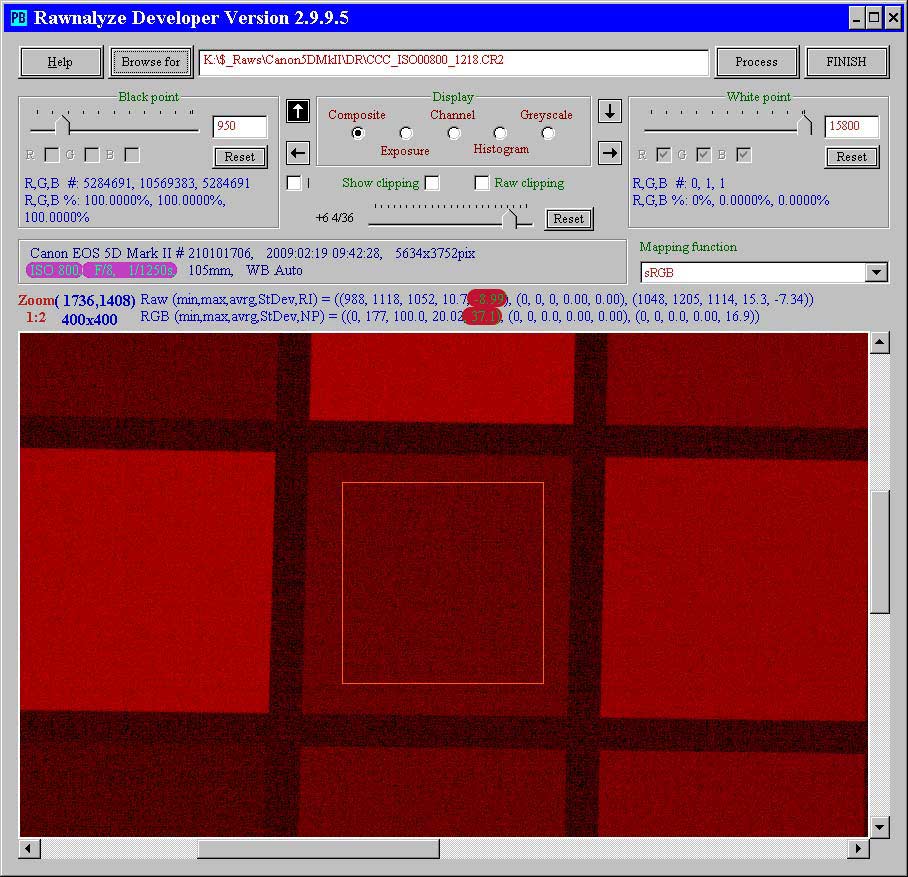
the noise is 37.1% with ISO 800, f/8, 1/1250sec
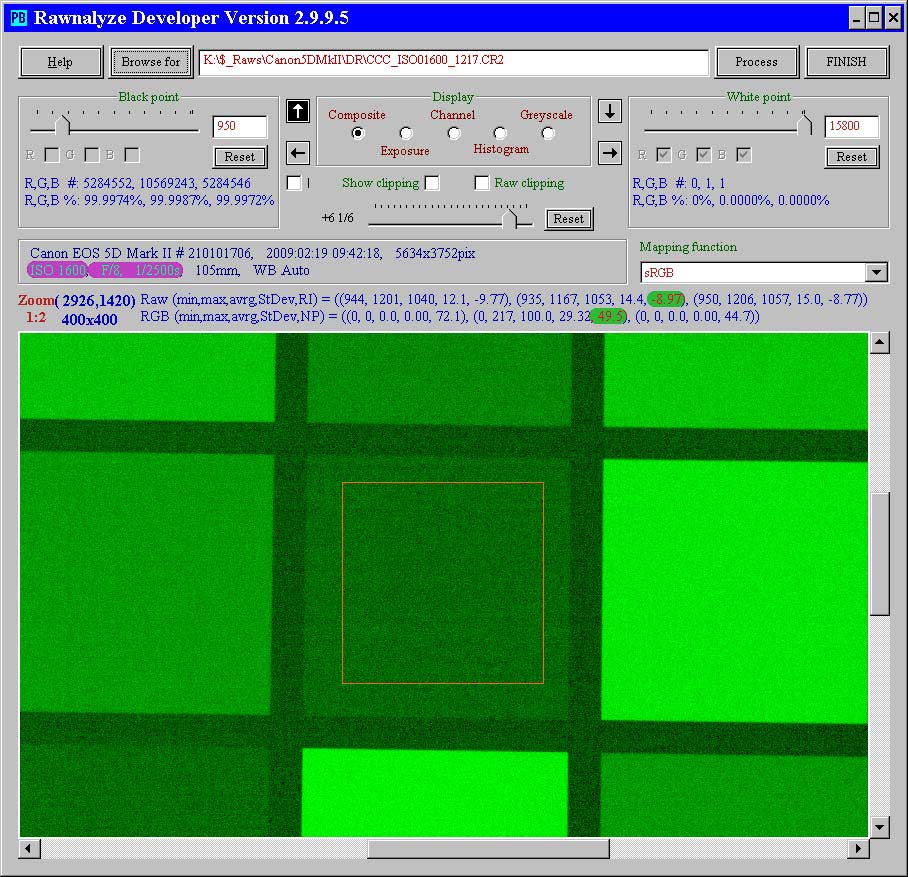
the noise is 49.5% with ISO 1600, f/8, 1/2500sec
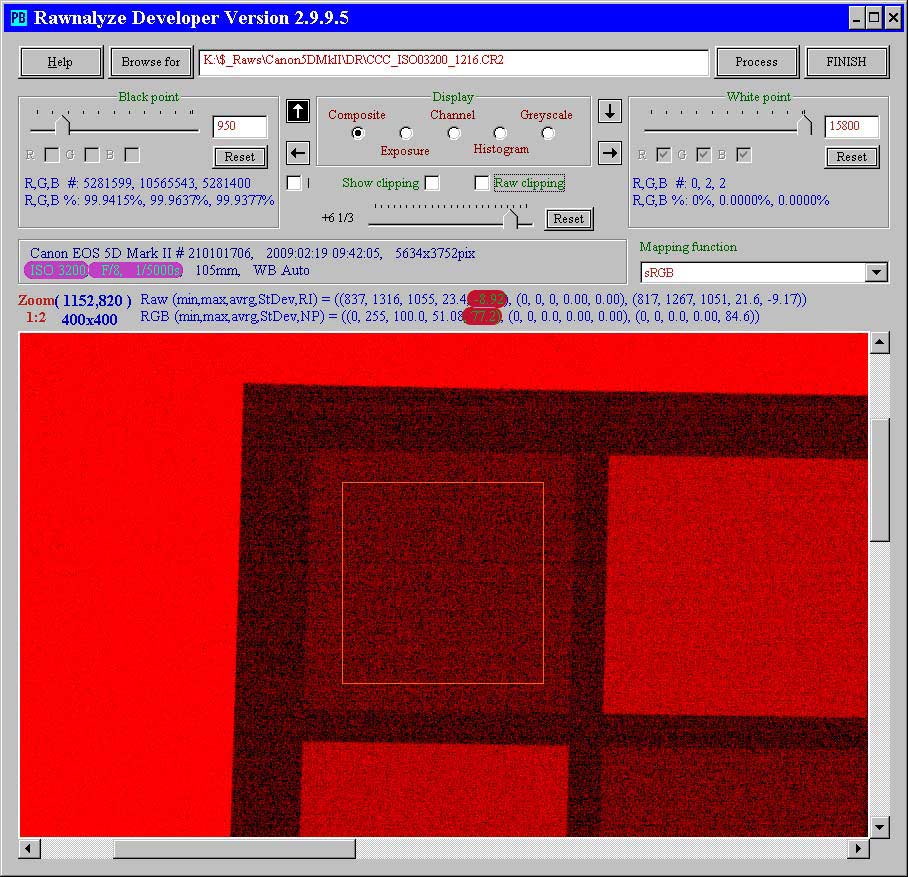
the noise is 77.2% with ISO 3200, f/8, 1/5000sec
The noise increases with decreasing exposure, even though the pixel intensity remains unchanged due to the higher ISO setting. Obviously, the higher ISO setting is not an equivalent substitute for the higher exposure regarding the noise. Does this mean, that the higher ISO settings are useless in the struggle against noise?
Let's see the effect of different ISO settings while keeping the exposure constant. This could be measured on images shot with different ISO setting but constant exposure; however, images with different exposure too can be used, by selecting patches with the same illumination.
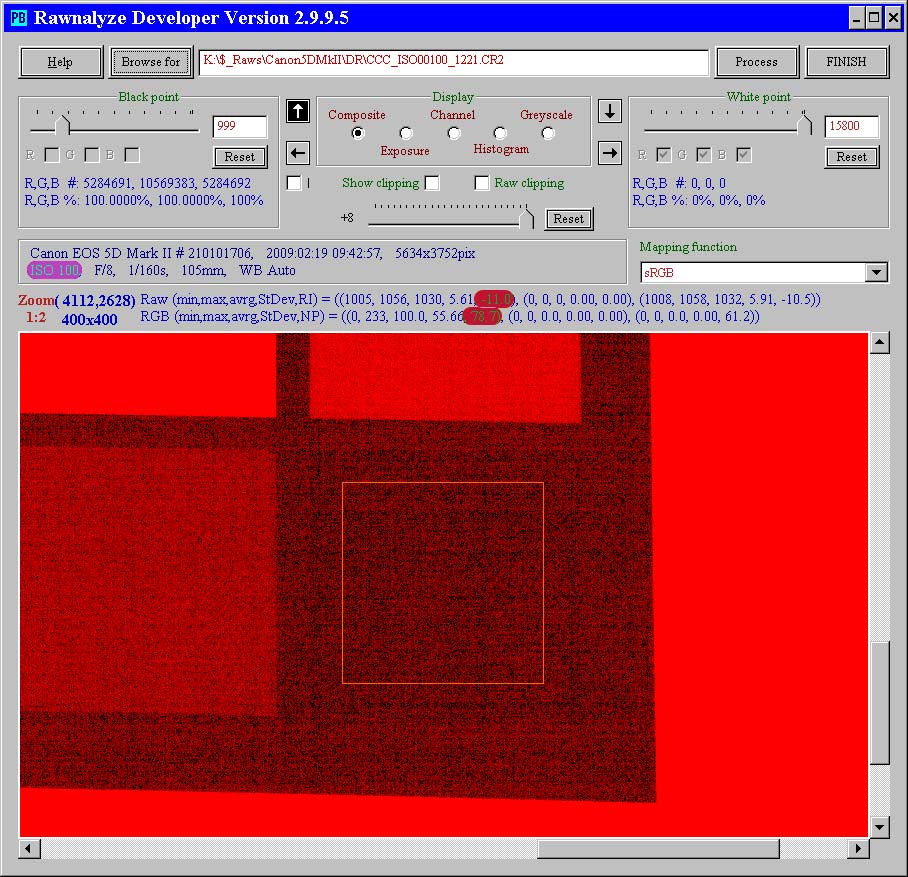
shot with ISO 100, the intensity of the selected patch is −11 EV, the noise is 78.7%
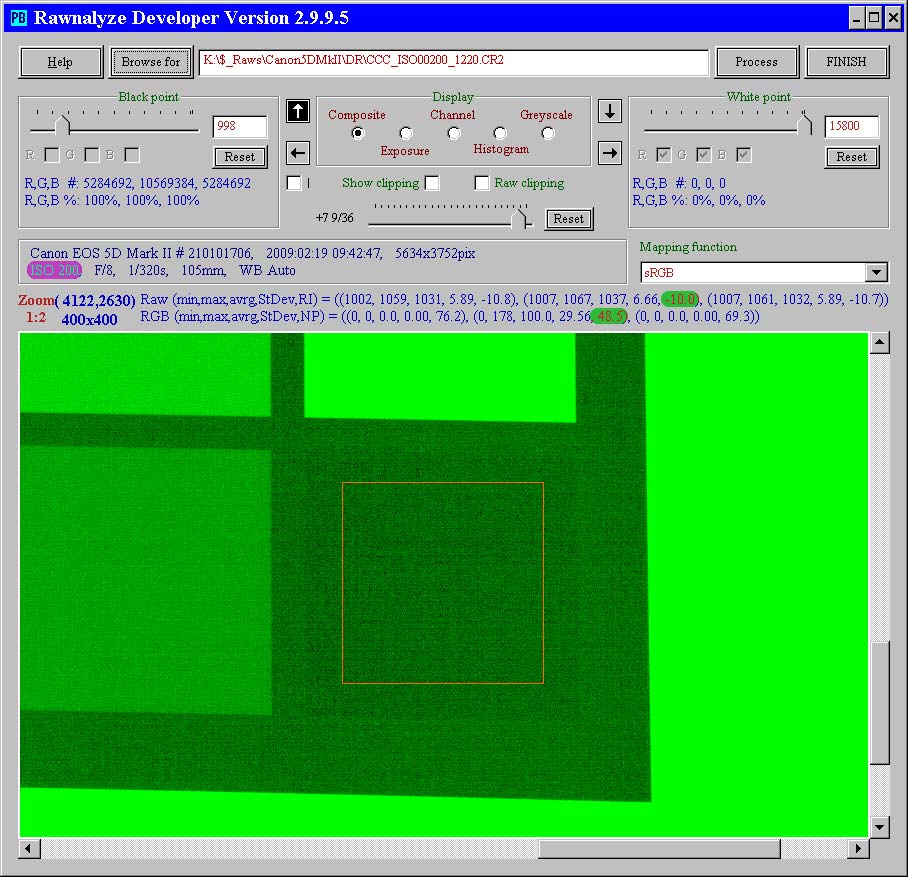
this image was shot with ISO 200; the intensity of the selected patch is −10 EV, this represents the same amount of light captured by the sensor as in the ISO 100 image. The noise is 48.5%; the reduction from 78.7% is due to the increased ISO.
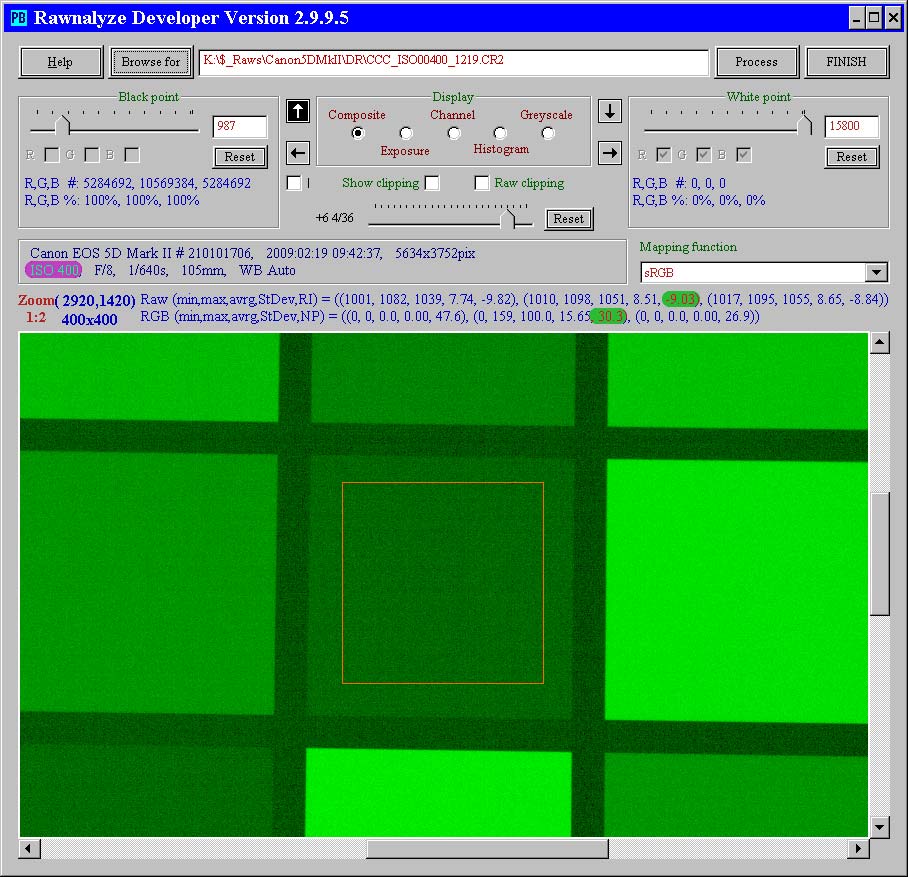
this image was shot with ISO 400; the intensity of the selected patch is −9 EV, this represents the same amount of light captured by the sensor as in the ISO 100 and ISO 200 image. The noise is now only 30.3%.
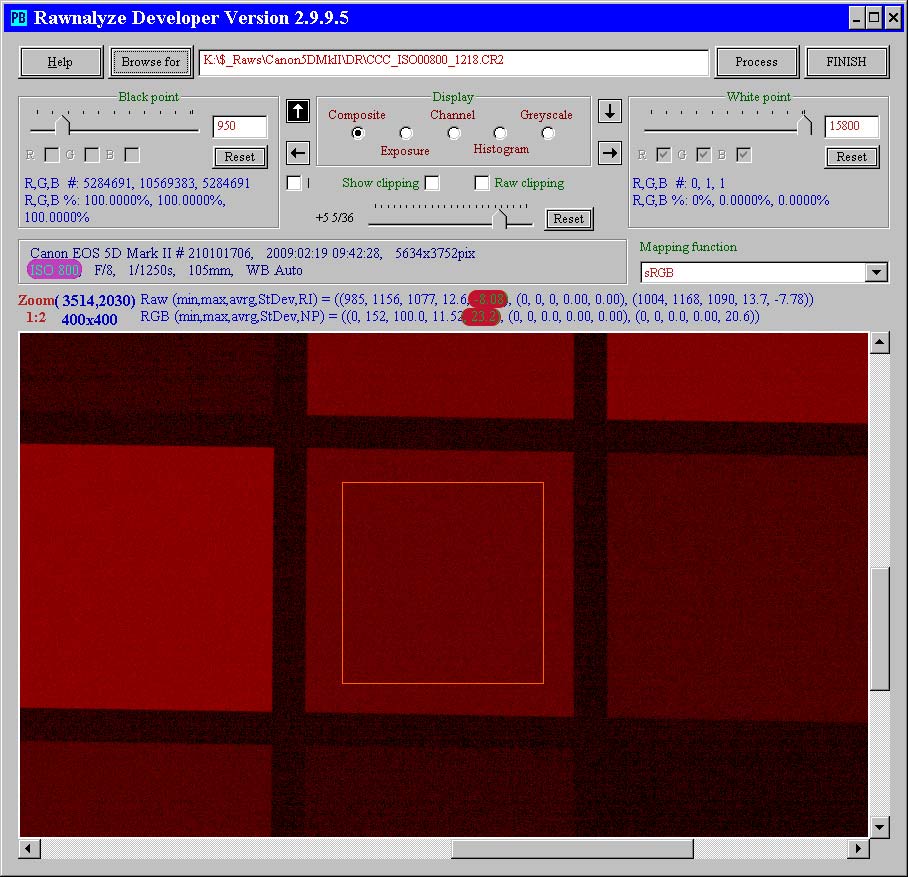
the next image was shot with ISO 800; the intensity of the selected patch is −8 EV, this represents the same amount of light captured by the sensor as in the ISO 100, ISO 200 and ISO 400 image. The noise is now only 23.2%.
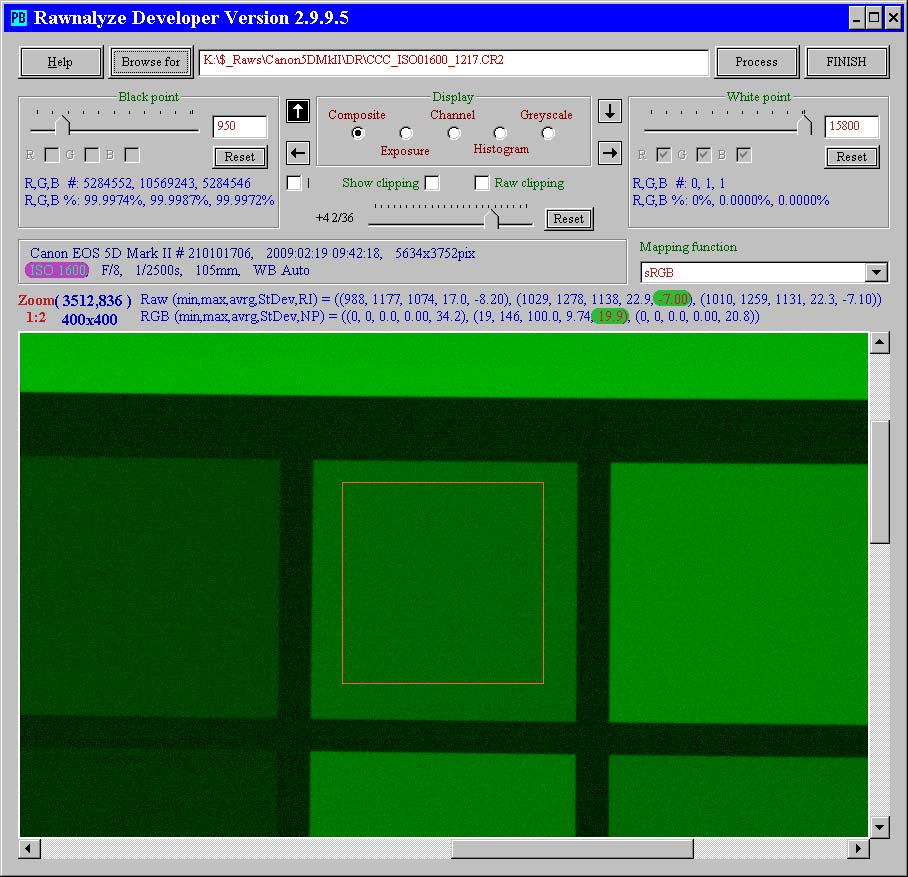
this image was shot with ISO 1600; the intensity of the selected patch is −7 EV, this represents the same amount of light captured by the sensor as in the images used in this serie above. The noise is now only 19.9%.
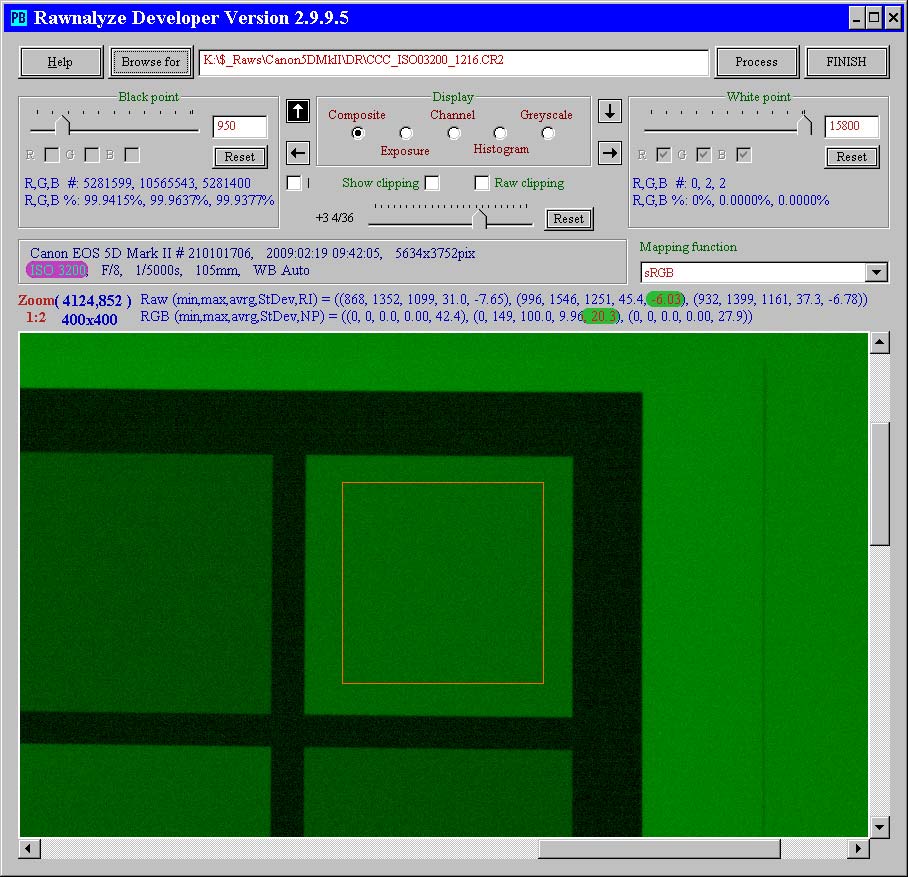
this image was shot with ISO 3200; the intensity of the selected patch is −6 EV, this represents the same amount of light captured by the sensor as in all the above shots in this comparison. The noise is now 20.3% (the slight increase from 19.9% is within the accuracy of the demonstration).