Rawnalyze
Magnifying, reducing the image size
Scrolling, positioning the image
Changing the original raw data
Dialog elements
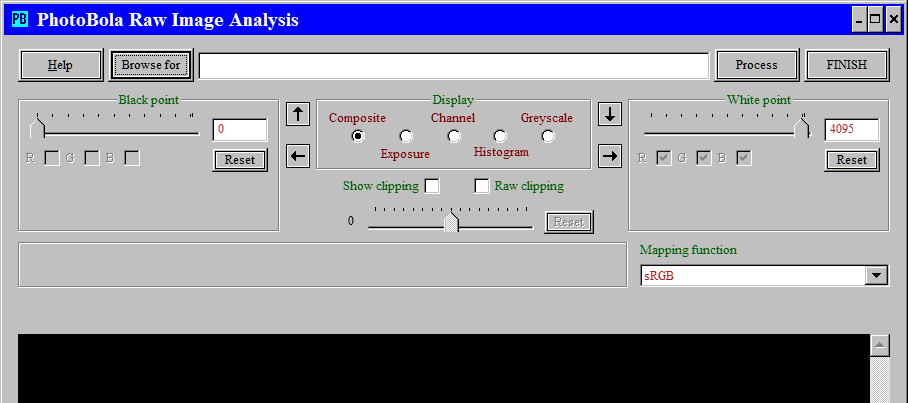
After starting Rawnalyze, following dialog window appears:

The capture has been created in the initial state
The first step after having started the program is usually locating the raw file and opening it. The file specification can be typed in directly;
clicking on Process starts opening and reading the file. However, more often the Browse subdialog
will be used to select the raw file to process. After a file has been selected, it will be opened and read immediately, there is no need to click
on the Process button; in fact, there is no need to click on Process any more while analyzing the
same raw image. The only exception is, when switching between analyzing modified and unmodified raw data, see Changing the original raw data later.
Clicking on Process initiates opening and reading the raw file again, causing a considerable delay in response time.
The shortcut for starting the file browse dialog is Ctrl-O.
Displaying the manual through a Web browser via the Help function may become necessary, but if someone is reading this page, then that goal has been accompished already.
As there is not much else to say about this screen shot, let's skip ahead through opening an actual raw file.
Resizing the dialog window (click to display this section)
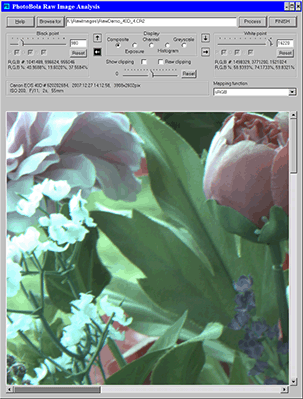
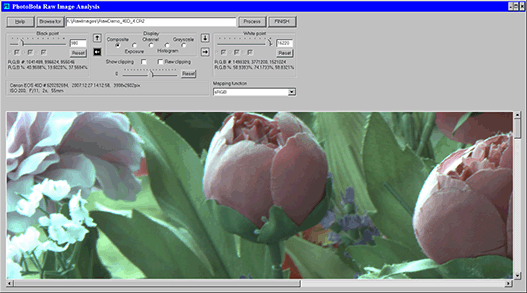
The size of the image window changes together with the dialog frame size; this way the image can be viewed with less scrolling in a larger
image window. Here are two examples for different dialog frame sizes:
Magnifying, reducing the image size (click to display this section)
Typing in the - (minus) character reduces the magnification. In composite color and greyscale display mode the display size can be effectively reduced, so that each color filter array block is represented by a single pixel.
The normal view (no magnification, no reduction) can be reinstated immediately by entering Alt, Ctrl and S.
The current magnification/reduction state is displayed above the top left corner of the image frame.
Examples:
This is the image from the selection example below in reduced size
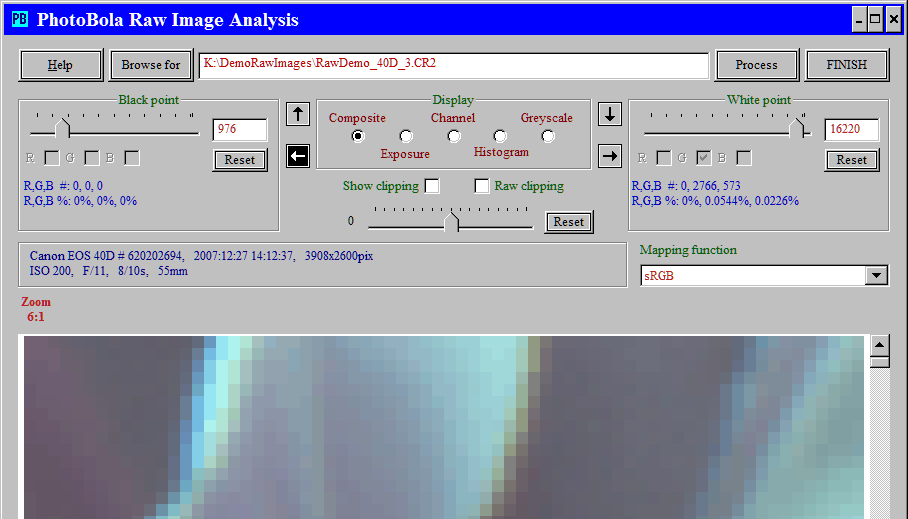
and here the same image in six times magnification
Scrolling, positioning the image
Raw images from newer cameras are quite large, some of them are very large. Looking through the image, even in reduced size view can be tedious. A multitude of scolling/positioning options are available to make this task faster.As long as the mouse pointer is not over the display area (while a scroll bat is active):
This way a precise position can be established.
Working with the sliders
A slider can be adjusted by dragging it: left-clicking on the slider pointer, holding down the left button and moving the mouse. Clicking on the trackbar (the line going in the length of the slider) at the left or right to the slider pointer moves the slider by one "page".While the focus is on a slider, it can be moved just like a scroll bar, using the arrow keys, PageUp, PageDown, Home and End. The magnitude of change the arrow keys or PageUp and PageDown cause depends on the slider.
The slider becomes focused after having clicked on any part of it, and it remains focused until clicking on another control (a button, an input
field, etc.) If the slider is focused, it is framed by a thin dotted rectangle, like this one: 
Each sliders is accompanied by a Reset button, which sets the slider to its initial position.
There are other, very special ways to control the black point and white point values, and thereby the respective sliders; those are described in the Pixel selection.
Changing the original raw data
The raw data remains unchanged in memory in the entire duration of the analysis. However, the raw pixel values may be changed on a particular way immediately after having read the data. That change can not be reversed, the raw file has to be opened and read again in order to work with the original rax pixel values.Following options are available:
Black level correction becomes somewhat inaccurate through this change, although changing only two-three bits from 14 does not make this noticable,
Black level corrections will be applied before this change and then reset to zero, so that it do not get applied later again. Also the white point and the histogram range will be adjusted.
The special key combination has to be kept pressed down when clicking on the Process button or when starting processing of a raw file in the Browse dialog. It's enough to keep these keys pressed one or two seconds long.
Note, that
Pixel selection
When displaying the image in normal size, a rectangular area of the display can be selected by right-clicking at a point of the display, holding down the right mouse button and dragging the selection in the direction and to the size needed. The selected area is marked by an orange rectangle. Another selection can be made at any time; the previous selection will be released. The selection can be removed by the keyboard action Ctrl-D.
An important aspect of the raw pixel analysis is determining, which pixels should be involved in it and how. The selection is based on the color and value of raw pixels.
The effect of pixel color and value selection is described in other chapters, here we deal only with the way the selection occurs.
The tools of pixel selection are:
The current values are shown in the respective input field. The range of possible values for both limits is
The initial value of the black point is either
(il s'agit des valeurs dans les champs éditables, commandés par les deux curseurs sur leur gauche. Les nombres dans les champs "statistiques" sont discutés plus loin)
The initial value of the white point is either
The black point and white point can be set to the same value, thereby limiting the range to a single pixel value. The black point can not be higher than the white point. Selecting a higher value for black point than the current white point is, or a lower value for white point than the current black point is results in changing the other limit as well to the same value.
As the pixel value limits need to be adjusted very often, sometimes with small changes, sometimes faster, a multitude of adjustment options are available. The values can be changed by
The special controls are:
All the above actions change the other limit as well, if required, to maintain that the black point is never higher than the white point.
Following actions always change both limits together from their actual value, no matter if the focus is in the black point or white point input field:
When reaching the lower or upper limit of specifications, it can occur that only one of the values get changed.
The statistics will be changed when checking or unchecking Outside range, reflecting the changed selection. The sum of the pixel counts in inside and outside mode is not necessarily the total number of the pixels with the respective color, because pixels with values matching a limiting value are counted both inside and outside.
This option can be checked or unchecked only in exposure display mode, therefor it may be necessary to change to exposure display mode in order to check or uncheck Outside range and change back to the other display mode, so that the statistics are adjusted according to this option.
The numbers under the color selection checkboxes in the black point and white point cntrol group reflect the number of pixels in the respective group, determined by the actual black point and white point values and by the inclusion/exclusion selection. The proportion of the selected pixels too is displayed, related to the total number of pixels of the particular color in the related group.
The pixel statistics values are not updated after certain selection adjustments, in order to shorten the response time. In such cases the statistics is not shown; typing Enter causes the statistics recalculated and displayed.
??? Pas clair du tout. Les statistiques dans le bloc black point ne tiennent aucun compte du white point choisi (et réciproquement). Les valeurs dans le bloc white point sont toujours très basses, quelle que soit le white point choisi. Par contre, les nombres dans le bloc black point ont l'air de pouvoir varier entre 0 et le maximum de pixels possible dans l'image
Both the black point and the white point control groups contain a checkbox for each color. In channel related display mode a color is selected if at least one of the respective boxes are selected (i.e. either in the black point control group or in the white point control group).
In exposure display mode the selection is more complicated. If Outside range is unchecked, then
If Outside range is checked, then
The statistics shown in the black point and white point control groups are not affected by the color selections. However, the distribution of the values between the black point and white point control groups reflects the separation of "black" and "white" (or "lower" and "upper") range.
Area selection
When displaying the image in normal size, a rectangular area of the display can be selected by right-clicking at a point of the display, holding down the right mouse button and dragging the selection in the direction and to the size needed. The selected area is marked by an orange rectangle. Another selection can be made at any time; the previous selection will be released. The selection can be removed by the keyboard action Ctrl-D.The unit of selection is the color filter array pattern, i.e. a block of 2x2 pixels, not individual pixels. Thus a single pixel can not be selected.
The selection remains active between different display modes. When changing to histogram mode or to reduced size display, the selection remains defined but not displayed, nor is the related statistics displayed. When changing back to normal size display or to image or exposure display mode from histogram display, the selection will be shown again with the related statistics.
It is important to understand, that a part of the display area is selected, not a part of the image. When the image position is changed, the selection remains on the very same place, i.e. another part of the image gets selected, and the statistics is recalculated.
The selection remains unchanged even when opening another image; this is useful when comparing two images of the same scenery.
The use of a selection is:
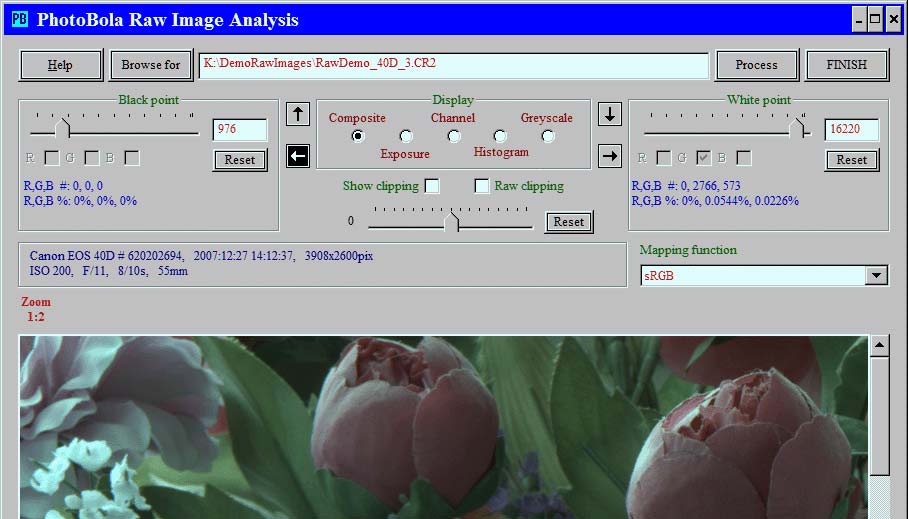
Following screen capture helps explaining the display associated with a selection:
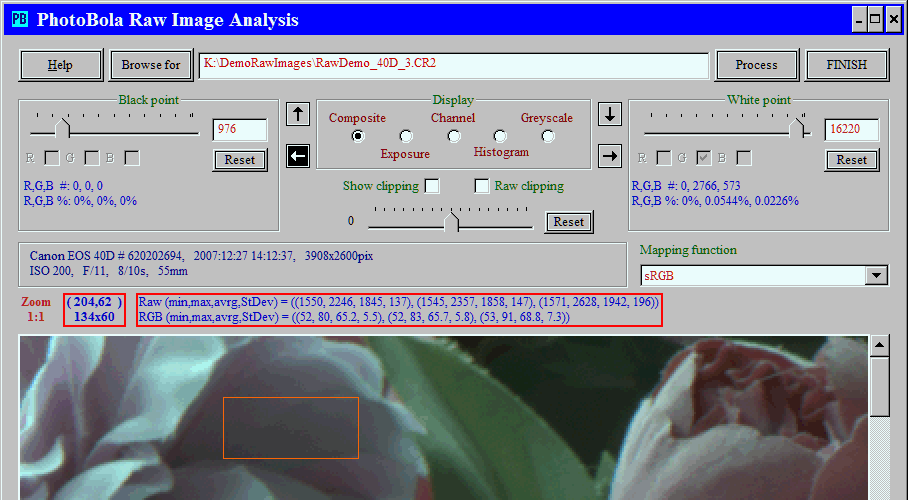
The orange colored rectangle frames the selected area;
the red rectangles mark the associated information.
The red markings do not appear on the dialog window,
they are drawn only for the sake of explanation.

The numbers in the top row, between brackets show the position of the selected area in the entire image; the first number is the horizontal position from 0, the second one is the vertical position from 0. The co-ordinates are always even numbers, because the selection occurs in units of 2x2 pixel blocks.
The bottom row contains the size of the area in pixels, width by height; these too are always even numbers.
Note, that when the image position changes, the co-ordinates of the selected area change accordingly.
![]()
The data in the first row relates to the raw pixel values. There are three groups of data, relating to the red, green and blue pixels, respectively. Each group contains four numbers:
I think a short explanation may be useful regarding the "intensity".
What is the intensity of a certain patch in the raw image, how can it be measured and expressed? The brightness (the RGB values) is useless for
this purpose: it depends on adjustments, on WB and on the mapping. The pixel values or their averages? They are useful only within a single
image, but even so they can serve only to determine, which area was higher or lower exposed, but they do not necessarily reflect the
proportions between the intensities.
The problem with the pixel values is, that they are not so absolute as one would think of plain numbers. Think of 12bit and 14bit depth - 4095
is the greatest number with 12bit, but is is quite low with 14bit - and this is not all. Many cameras do not utilize the entire numerical range
of the bit depth, and/or the lowest meaningful pixel value is not 0. Example: the Canon 40D's meaningful pixel values start at around 1000
and clipping occurs at 12740, 13820, 16220 or 16383, depending on the ISO. Or think of the Nikon D300, D3, D700, D3X: the user can select
between 12bit and 14bit raw data.
Accordingly, the intensity represented by a given pixel value can be evaluated only after removing these variables. The AI value represents the
result of this evaluation, measured from the current clipping point downwards. For example if the average pixel value is half as much as the
pixel value range in the given image, then the intensity is one EV down from clipping; this will be expressed as -1.00 EV.
The data in the second row reflects the RGB values, as the pixels appear on the display:
The RGB values depend, beside on the raw values, on clipping indication, black point, white point, lightness correction, white balance and the mapping function. Changing any of these settings will be immediately reflected in the selection statistics. Likewise, the effect of changing the image position (scrolling, moving the image around) becomes immediately visible in the statistics.
Tooltips:
The initial selection is composite. Any selection remains effective after opening another image.
The black arrow represents the image orientation, relating to the normal orientation of the camera, which is landscape for most cameras
(wider side horizontal), but some cameras' normal orientation is portrait.
 denotes the normal orientation,
 denotes the left turned orientation, which is how most cameras are held
for portrait orientation,
 denotes the right turned orientation, which is how a few people are
shooting in portrait mode,
 denotes the upside down orientation.
The initial orientation is the one recorded in the raw file. If the orientation is not recorded, then the initial orientation is upright. When clicking on an arrow, the displayed orientation is changed to the one corresponding to that arrow.
The image can be rotated by 90° to the left with the keyboard action Ctrl-L and 90° to the right with the keyboard action Ctrl-R.
The black point control group and the white point control group are explained further down. Click to jump at Pixel selection.
The unlabelled slider is for lightness adjustment. The adjustment can be made at 1/3 EV, 1/2 EV or 2/3 EV points. (Note, that this adjustment is often referred to as exposure adjustment, however that is an incorrect usage of the term, for the exposure can not be adjusted after the shot has been made.)
The initial position of this slider is usually at null, but in some cases it shows an adjustment, which is indicated in the raw file. Example: Canon 40D images shot with the Highlight Tone Priority (HTP) option start with an adjustment of +1.
Depending on the selected display mode, different checkboxes appear as selection of further options. These are described with the related display mode.
Selection of the mapping function decides, which mathematical function will be applied, when transforming the linear raw data in a more displayable form in composite color, channel or greyscale mode. Some of the functions are designed to vastly increase the contrast in the highlights, while creating strange side effects.
Note, that only the color intensity of the displayed image is affected by the selected function. The colors themselves are of the camera's color space and don't get transformed in sRGB, etc.
The shooting data consists of the camera maker and model, camera body serial number, date and time of the shooting, image dimensions, ISO, aperture, shutter time and lens focal length; some of these may be missing.
Notes:
The statistics under Black Point shows the number and proportion of the selected pixels in the lower range. This statistics is affected by the black point value and by the Outside range selection.
The statistics under White Point shows the number and proportion of the selected pixels in the upper range. This statistics is affected by the white point value and by the Outside range selection.
Notes on the pixel statistics:
The current zooming indicator; for example indicates 3x magnification, while
shows, that the reduced size image is displayed.
In the normal view each pixel of the raw image is displayed as a pixel on the monitor. The image can be magnified by typing in + (plus) character; repeated typing can increase the magnification to up to ten times.
Typing in the - (minus) character reduces the magnification. In composite color and greyscale display mode the display size can be effectively reduced, so that each color filter array block is represented by a single pixel.
The normal view (no magnification, no reduction) can be reinstated immediately by entering Alt, Ctrl and S.
The position and size of the current area selection, see Area selection below.
Pixel statistics of the current area selection, see Area selection below.
Example of area selection.
When displaying the image in normal size, a rectangular area of the display can be selected by right-clicking at a point of the display, holding down the right mouse button and dragging the selection in the direction and to the size needed. The selected area is marked by an orange rectangle. Another selection can be made at any time; the previous selection will be released. The selection can be removed by the keyboard action Ctrl-D.